Examples of use#
The python package calls the DHLAB API to retrieve and present data from the digital texts.
Analyses can be performed on both a single document, and on a larger corpus.
Here are some of the text mining and automatic analyses you can do with dhlab:
Build a corpus#
Build a corpus from bibliographic metadata about publications, e.g. books published between 1980 and 2005:
import dhlab as dh

corpus = dh.Corpus(doctype="digibok", from_year=1980, to_year=2005)
Word frequencies#
Retrieve word (token) frequencies from a corpus:
# Frequencies of each word (rows) per book, referenced by their unique ID (columns)
corpus.count()
Bags of words#
Fetch chunks of text (paragraphs) as bag of words from a specific publication:
docid = "URN:NBN:no-nb_digibok_2007091701028"
c = dh.Chunks(urn=docid, chunks="para")
c.chunks[0]  # The first bag-of-words is the title
# {'TROLLBYEN': 1}

c.chunks[1] # Second bag-of-words is a paragraph, with word counts
Concordance#
Extract concordances from the corpus:
concs = corpus.conc(words="troll")

concs.concordance
# Output is a pandas Dataframe,
# including links to the concordance's positions in books on nb.no
Collocations#
Compute collocations, a ranking of relevant words to a given word:
colls = corpus.coll(words="sol")
colls.coll.sort_values("counts", ascending=False).head(10) # The top 10 most relevant words to "sol" in our corpus
       counts
,          10
.           9
og          5
på          3
nicht       3
man         3
the         3
to          3
lte         3
ein         3
N-grams#
Retrieve n-gram frequencies per year in a time period.
from dhlab.ngram.nb_gram import nb_ngram
n= ng_ngram("sol,troll,skog")
n.plot()
The plot method gives us this graph:
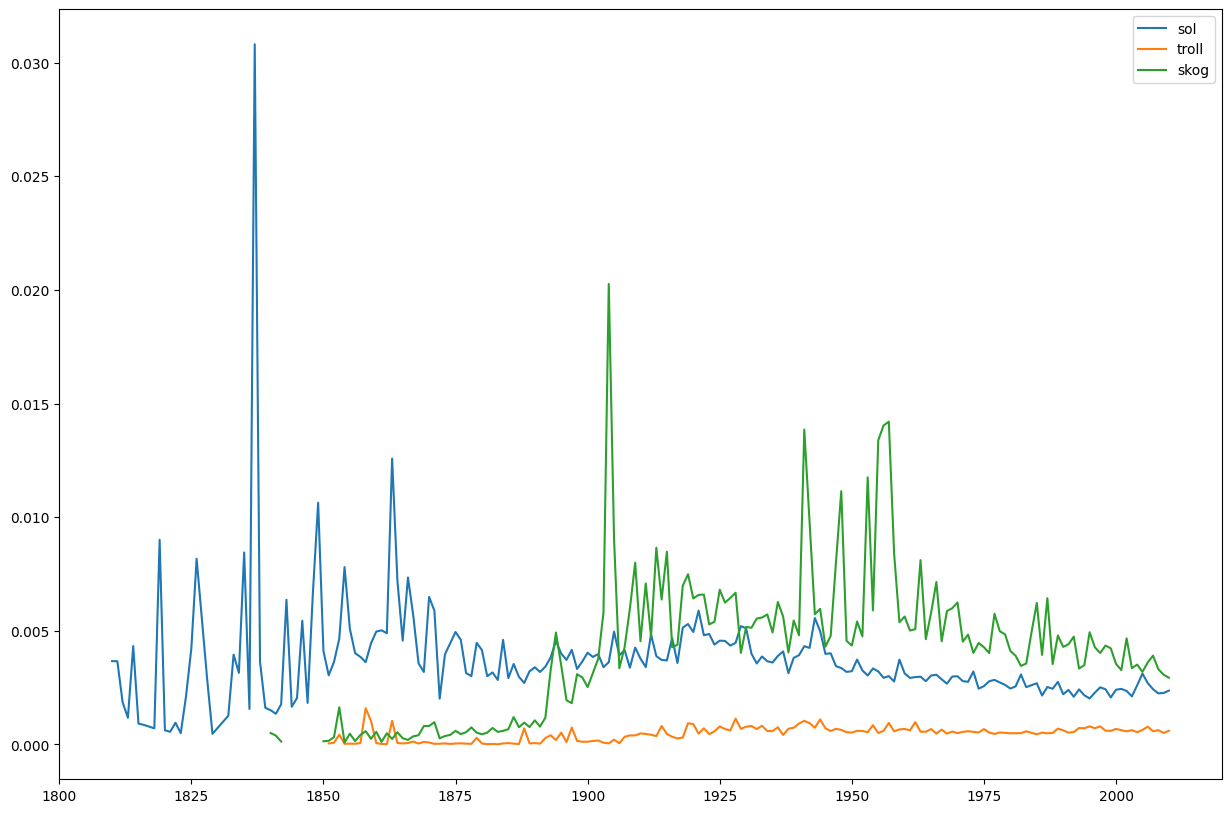
Check out our N-gram app for an online visual graph of all uni-, bi-, and trigrams in the National Library’s digitized collection of publications.
Named Entity Recognition#
Extract occurrences of named entities, for example place names:
from dhlab import NER

docid = 'URN:NBN:no-nb_digibok_2007091701028'
ner = NER(docid)
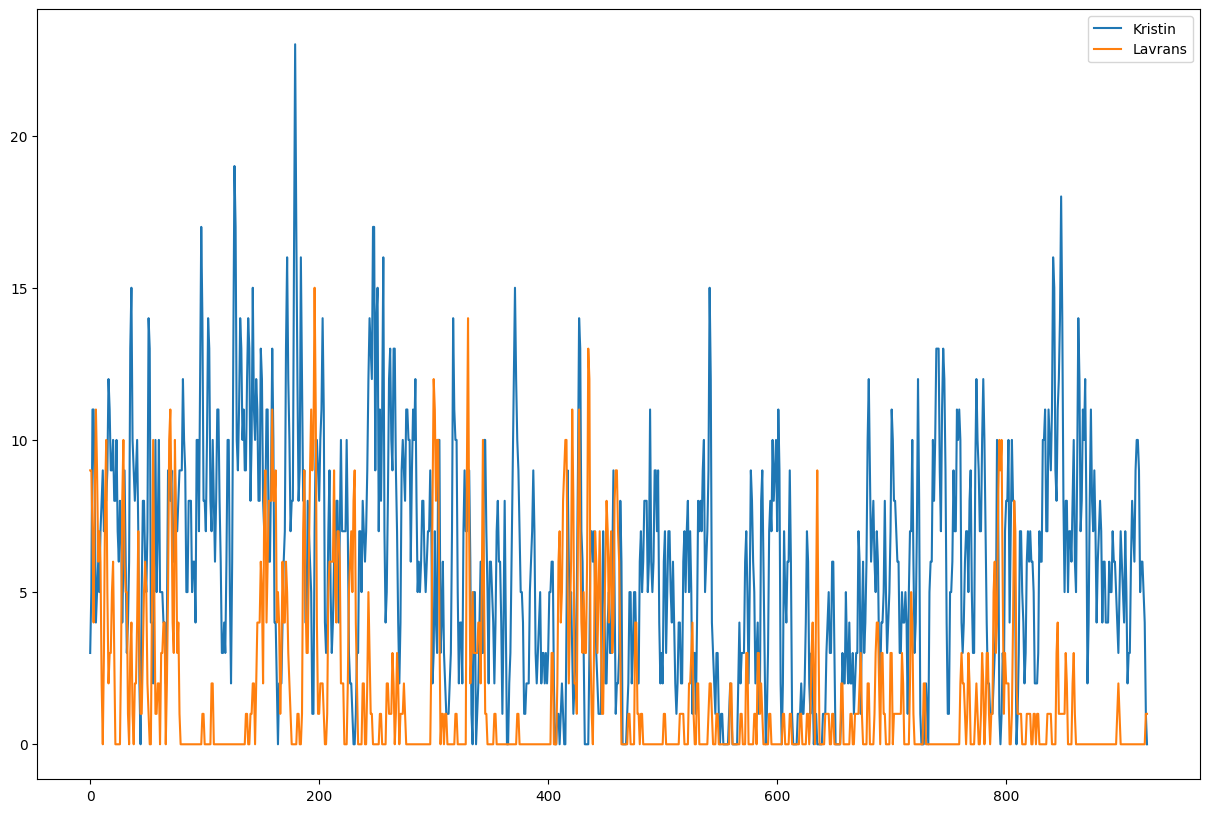
Word dispersions#
Plot narrative graphs of word dispersions in a publication, for instance in “Kristin Lavransdatter”:
from dhlab.text.dispersion import Dispersion

docid = "URN:NBN:no-nb_digibok_2018021248144"
d = Dispersion(docid, wordbag=["Kristin","Lavrans"], window=1000, pr=500)
d.plot()
Dispersion.plot() gives us this diagram: